Practicing with Polylines
Article Table of Contents
This is a first pass at trying to do something interesting (repeatedly) with the same base primative, in this case, a “polyline”.
The polyline in question I got from Strava, after recording a scooter ride.
This post should be interesting to programmers and non-programmers alike. A polyline is a way of encoding a bunch of latitude/longitude pairs, so it can be drawn in detail on a map.
Here’s what the polyline looks like, raw:
qonqFj}z_SG@IQW?GCKQ?UGIa@AGGAKCZA@c@M_@?GIOMYIMSa@?GAUDOAGG?QDGNBAHPFJ?BCMI[B?E@HDB@JBKD@C@@AACEI
And, converted to lat/long pairs, this makes a bunch of points:
_update, using a different polyline than what I started this whole thing off with - it was maybe giving me issues.
39.72873,-105.00070
39.72877,-105.00071
39.72882,-105.00062
39.72894,-105.00062
39.72898,-105.00060
39.72904,-105.00051
39.72904,-105.00040
39.72908,-105.00035
39.72925,-105.00034
39.72929,-105.00030
39.72930,-105.00024
39.72932,-105.00038
39.72933,-105.00039
39.72951,-105.00032
39.72967,-105.00032
39.72971,-105.00027
39.72979,-105.00020
39.72992,-105.00015
39.72999,-105.00005
39.73016,-105.00005
39.73020,-105.00004
39.73031,-105.00007
39.73039,-105.00006
39.73043,-105.00002
39.73043,-104.99993
39.73040,-104.99989
39.73032,-104.99991
39.73033,-104.99996
39.73024,-105.00000
39.73018,-105.00000
39.73016,-104.99998
39.73023,-104.99993
39.73037,-104.99995
39.73037,-104.99992
39.73036,-104.99997
39.73033,-104.99999
39.73032,-105.00005
39.73030,-104.99999
39.73027,-105.00000
39.73029,-105.00001
39.73028,-105.00000
39.73029,-104.99998
39.73032,-104.99993
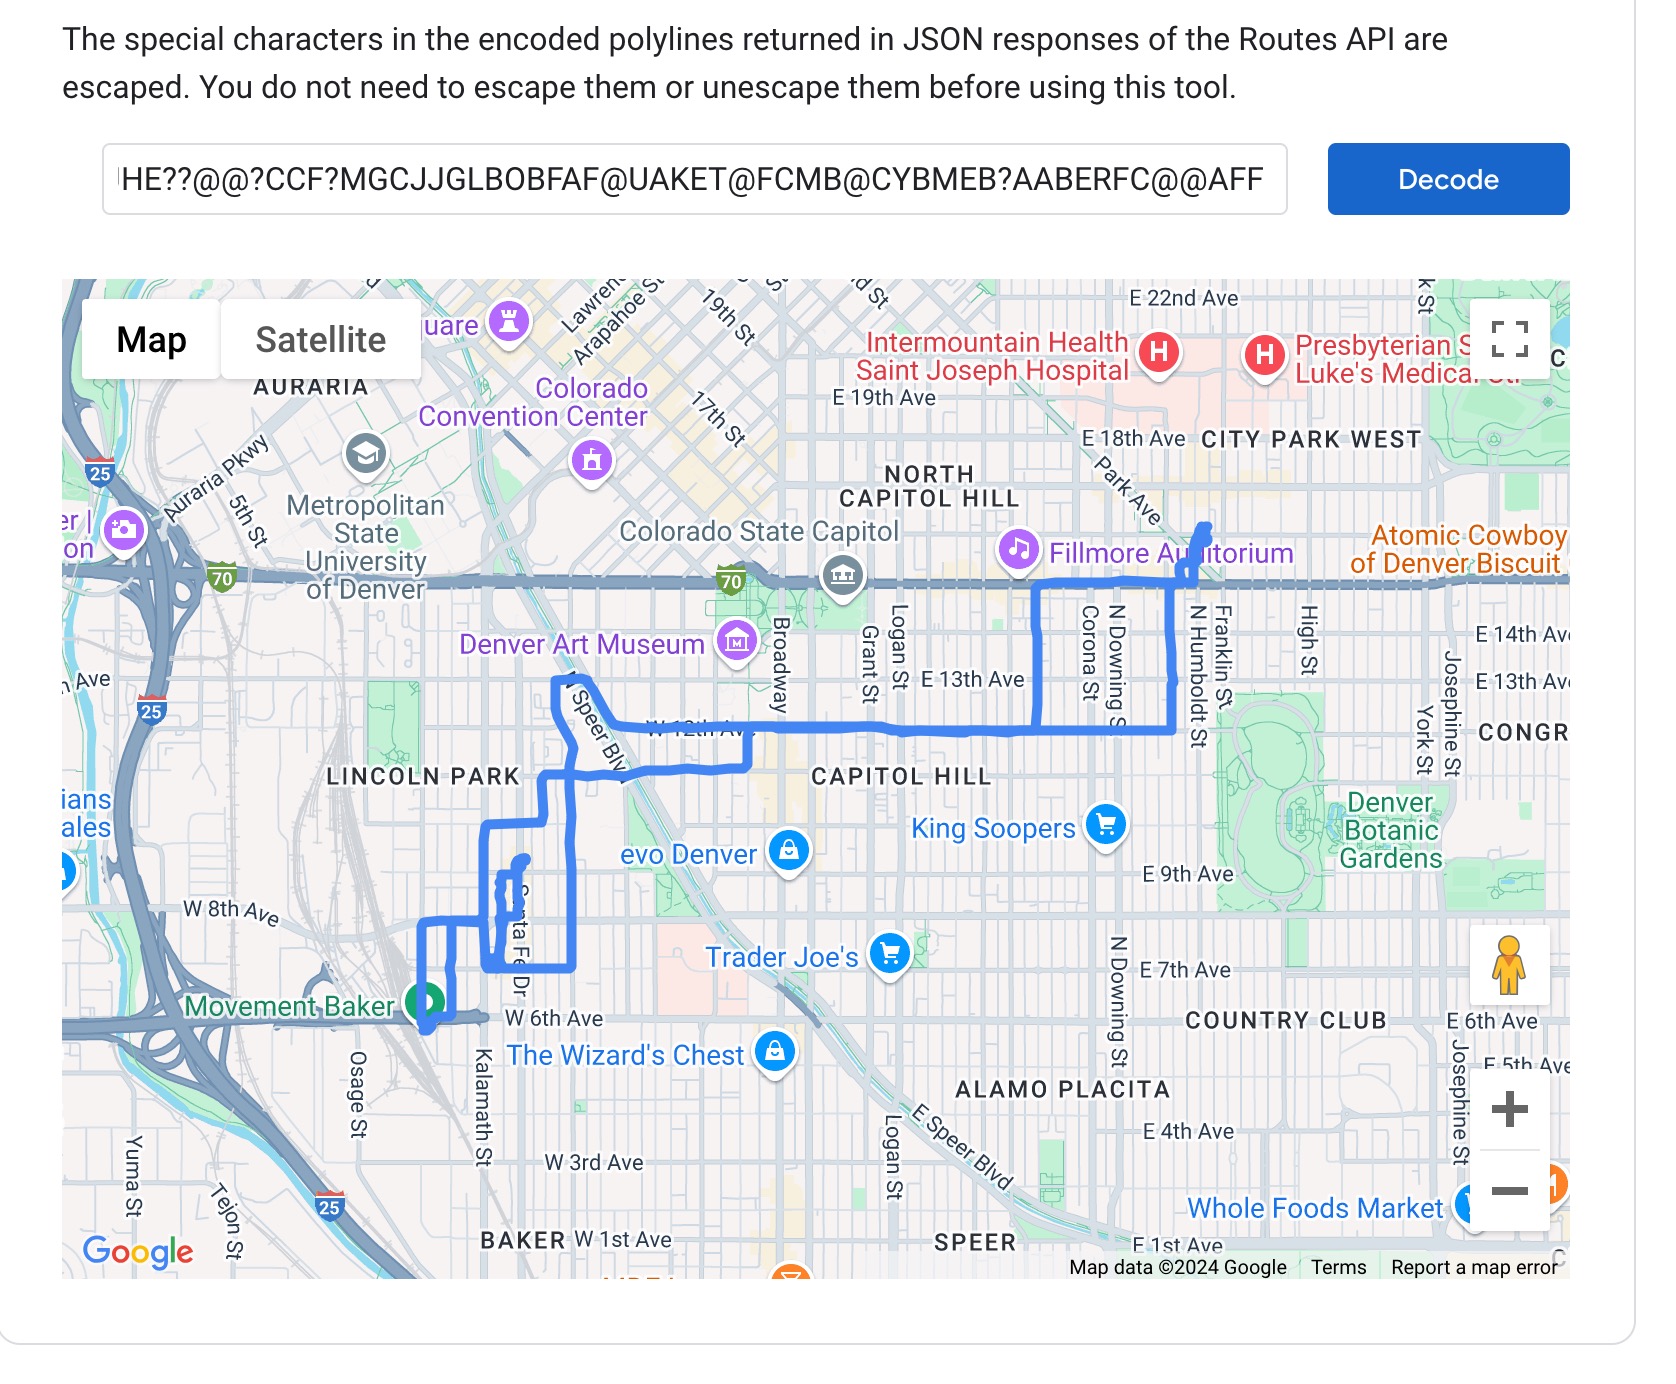
One can pop the polyline into Google’s polyline decoding utility to see it rendered. Here’s what the original polyline I was working with looks like:
Now, lets do something interactive, close to what google is doing there under the hood.
I’ve used Leaflet before, and mapbox, a little, so I’m going to start with those.
Lets rander a bare map, but open it up to about where the polyline will go. I’m sorta writing this blog post top down. Lets add a map, and initialize it.
Following the Leaflet quick start docs.
We sourced there css, then JS, then added a div for a map, did a tiny bit of styling, and minimum JS. Telling the map to open on Denver’s approx lat/long.
<link rel="stylesheet" href="https://unpkg.com/leaflet@1.9.4/dist/leaflet.css"
integrity="sha256-p4NxAoJBhIIN+hmNHrzRCf9tD/miZyoHS5obTRR9BMY="
crossorigin=""/>
<!-- Make sure you put this AFTER Leaflet's CSS -->
<script src="https://unpkg.com/leaflet@1.9.4/dist/leaflet.js"
integrity="sha256-20nQCchB9co0qIjJZRGuk2/Z9VM+kNiyxNV1lvTlZBo="
crossorigin=""></script>
<div id="map"></div>
<style>
#map { height: 180px; }
</style>
<script>
var map = L.map('map').setView([39.742043, -104.991531], 13);
L.tileLayer('https://tile.openstreetmap.org/{z}/{x}/{y}.png', {
maxZoom: 19,
attribution: '© <a href="http://www.openstreetmap.org/copyright">OpenStreetMap</a>'
}).addTo(map);)
And here’s what that renders:


There we go! It worked! A basic map. Pinch and zoom and pan. Cool, huh? Lets add the polyline next. We’ll assign to to a variable, and ask Leaflet to decode it and add it to the map.
edit, that was really hard, what you’re about to see is a much smaller version of what I’d planned to do. It’s just a tiny fraction of the whole polyline, arbitrarily cut off at one end. I’ll explain what I did below.


Here’s what I did:
var map2 = L.map('map2').setView([39.736532, -104.977459], 17);
L.tileLayer('https://tile.openstreetmap.org/{z}/{x}/{y}.png', {
maxZoom: 23,
attribution: '© <a href="http://www.openstreetmap.org/copyright">OpenStreetMap</a>'
}).addTo(map2);
var latLngs = [
[39.72873,-105.00070],
[39.72877,-105.00071],
[39.72882,-105.00062],
// [lots more coordinate pairs here]
[39.73032,-104.99993]
]
var polyline = L.polyline(latLngs, {color: 'red'})
polyline.addTo(map2);
map2.panTo(new L.LatLng(39.73032,-104.99993), 23);
I wasn’t actually able to get the whole polyline decoded into lat/long coords, to make the issue smaller I used an online tool to paste the polyline in and get the coords back, then handled it as an array in javascript directly.
It was super janky, but works.
I realized I wasn’t sure if the polyline was working right - on this map, after panning and zooming to the last given coord, the whole line was bottomed out at like the 0/0 position of the map.
Soooo now it works.
Next time, might animate a marker moving along the line, something like https://github.com/openplans/Leaflet.AnimatedMarker?tab=readme-ov-file, or maybe make the line blink, or see if we can give a sense of which direction the movement was happening in.